ZIRP+174 Took Your Job, not AI
If you talk about AI and tech jobs (and the bloodbath of the last 3 years) without discussing ZIRP's rapid disappearance combined with §174 changing (*both* of which hit the fan in 2022), I can't take you too seriously...
I saw a chart going around on social media with “chatGPT released” overlaid on data showing two lines: the SP 500 and Total Job Openings. I added two new annotations (174 and ZIRP) to add more context:
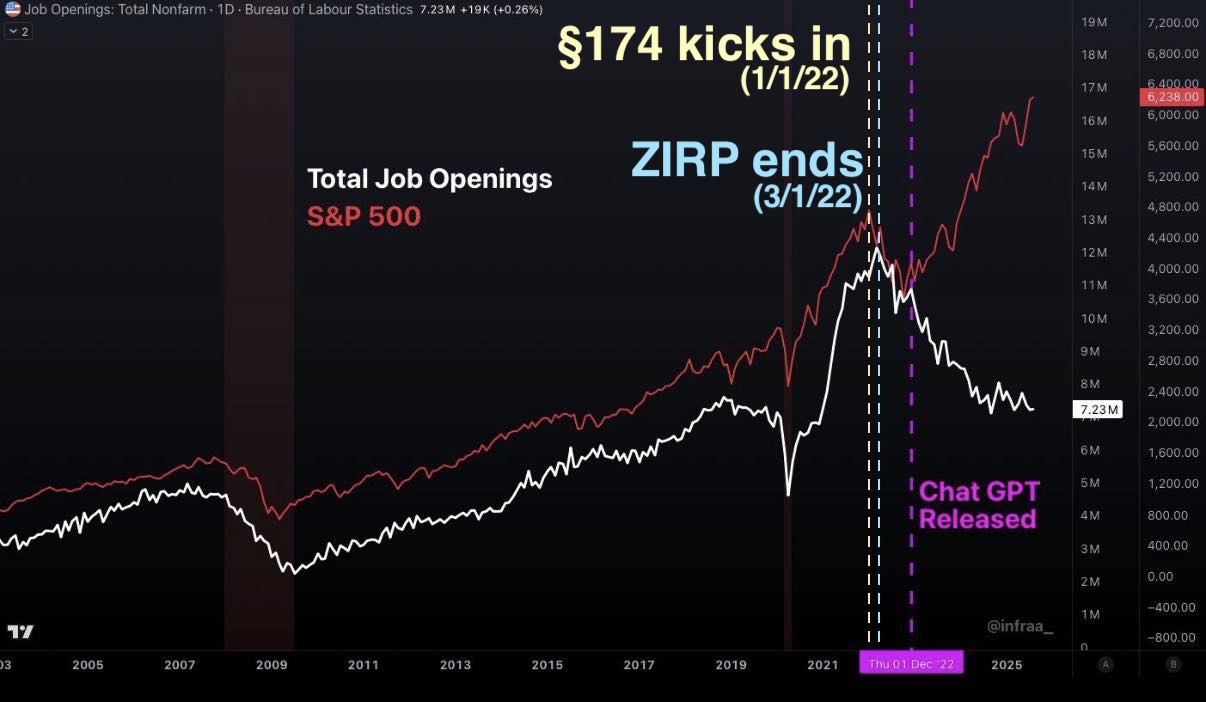
First off, job openings clearly were being hit before the release of GPT (and so was the stock market). The downturn had already begun. Knowing why one recovered and the other didn’t is key. And this is partly, if not majorly, because §174 kicked in Jan 1st of 2022 and was followed by our short, post-covid ZIRP effectively ending in Mar of 2022. Those two have been devastating for tech workers.
I am, by no means an expert, which is also why my alarm bells have been going off for years any time someone has offered the seemingly simple explanation that AI is taking jobs.
Really? Just AI? That’s too convenient. Do you really trust that’s how the world works? Nothing is ever that simple. It’s probably even more complex than ZIRP, 174, and AI combined. It always is. Interrogate your charts, people!
(That being said, chatGPT and the modern AI griftrastructure very likely explains why the stock market is going up - but not why jobs haven’t recovered!)
If you want to know more about what these two things are, here are my recommended primers:
What is ZIRP and how have historical ZIRPS worked?
How Trump’s tax code ticking time-bomb fueled mass tech layoffs